
Website Monitoring For Agencies Starts With The Portfolio
I spend a lot of time around agencies that manage websites.
Their site lists are rarely neat.
There are WordPress sites. Custom sites. Ecommerce sites. Brochure sites. Lead-generation sites. Sites built by former employees. Sites living on old hosting accounts. Sites behind Cloudflare. Sites sharing servers with other clients. Sites with plugins and integrations nobody wants to touch because nobody is completely sure what will happen.
And the problem is not one website.
It is keeping confidence across all of them.
An agency may be responsible for 20, 50, or 100 client sites spread across different platforms, servers, hosting providers, DNS providers, developers, and levels of access.
Something is always changing. A plugin updates. A certificate gets close to expiring. DNS changes. A firewall starts blocking a monitor. Several sites on the same server slow down. A form stops sending. A page gets marked `noindex`. An analytics tag disappears.
The site may still technically be online.
The client may still be the first person to notice something is wrong.
That is the problem I am building MetricPoints around.
The Product Direction Is Agency Website Assurance
I first wrote about rebuilding MetricPoints around agency website assurance in What I'm Building With MetricPoints. The goal is still simple to say: give an agency one place to see which sites need attention, what changed, how serious it is, whether several problems may be related, and what evidence exists.
That place is the portfolio.
Agencies need to be able to narrow it quickly. Show me the sites for this client. Show me the sites on this server. Show me the sites behind this CDN or firewall. Show me the sites using this DNS provider. Show me the sites with active incidents. Show me where monitoring evidence has gone quiet.
I do not want MetricPoints to show a green checkmark just because a homepage returned a successful response. A site can be up while its lead form is broken, its checkout is failing, its analytics has disappeared, or an important page is telling search engines not to index it.
If monitoring is missing or stale, I want that to be visible too. Agencies need an honest view of the sites they are responsible for, not a wall of reassuring green with no proof behind it.
What This Looks Like Across 30 Client Sites
Imagine an agency adds 30 sites to MetricPoints.
Most of them are fine.
One has an SSL certificate approaching expiration. Another has a recently published page accidentally marked `noindex`. A third no longer has the expected analytics tag. A fourth has a lead form that needs deeper monitoring before anyone can confidently say it is working.
Then five sites begin showing availability or monitoring problems around the same time.
Those five sites are hosted on the same server.
Now the agency has a useful starting point. There are four individual site issues to review, plus one possible shared infrastructure problem.
That is a lot more useful than 30 dashboards or nine disconnected alerts. The agency has a short list, and the list carries enough context to decide what to investigate first.
Infrastructure Groups Help Connect The Problems
One of the features I am especially interested in is infrastructure groups.
The name is not exciting. The problem they help solve is.
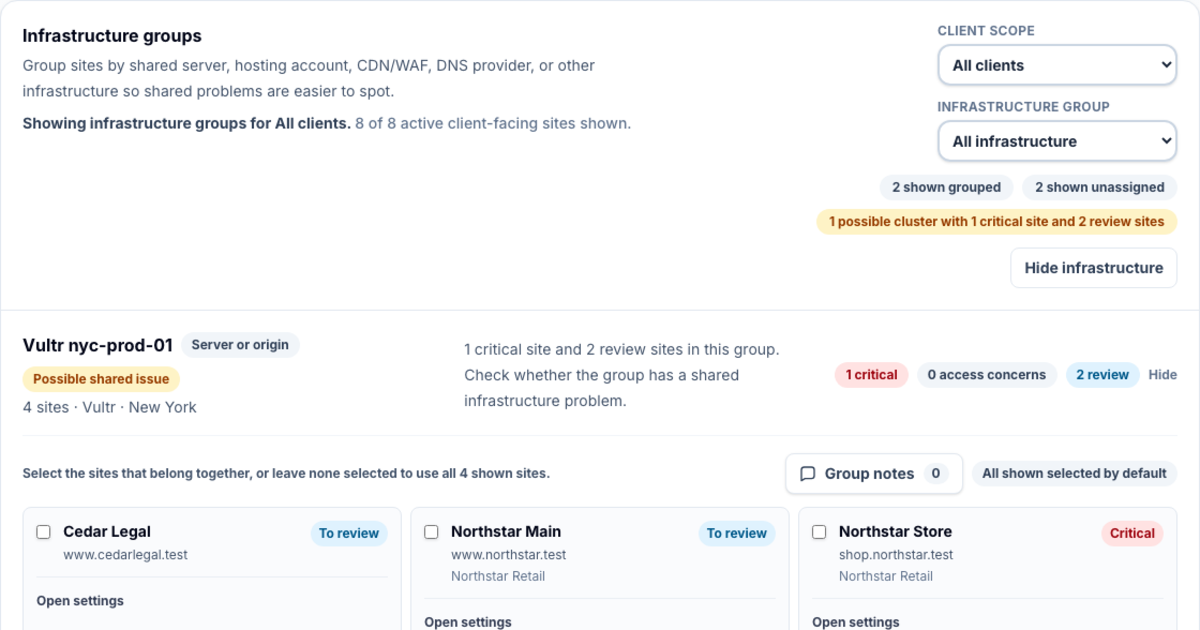
Agencies often have several client sites that share the same server, hosting account, CDN, web application firewall, DNS provider, or origin. When that shared layer has a problem, the symptoms can appear across several otherwise unrelated client sites.
Without that context, Site A timing out, Site B showing stale monitoring, and Site C returning errors can look like three separate incidents.
But what if all three sites live on the same server? What if they all sit behind the same firewall? What if a hosting change, DNS problem, resource limit, or probe allowlist issue is affecting all of them?
An agency can group sites by the infrastructure they share, and MetricPoints keeps that context visible in the portfolio. If several sites in the same group need attention at the same time, the agency has a much better place to start.
That does not prove the server or provider caused the problem. I do not want MetricPoints inventing root causes. It means these sites share infrastructure, several of them need attention, and the shared layer is worth checking before each site is treated as an unrelated failure.
Infrastructure groups can also carry their own alert route and team notes. A known maintenance window, hosting investigation, firewall change, or planned migration can stay attached to the group instead of disappearing into an inbox or private message.
This is the kind of context that can turn several noisy alerts into one useful investigation.
Different Sites Need Different Depths Of Evidence
Another important part of the product direction is external-first monitoring. I explained more of that decision in Protection Should Not Have To Start With An Installation.
An agency should be able to add a public website and begin watching it without installing a plugin or adding JavaScript first. MetricPoints can start checking availability, SSL, DNS, redirects, security headers, robots and indexability, sitemap health, analytics, forms, visual changes, assets, and monitoring freshness.
Sometimes the agency has hosting access but not WordPress access. Sometimes the client needs to approve a plugin. Sometimes the site is not WordPress. Sometimes the agency has 50 sites and does not want onboarding to become 50 separate installation projects.
External monitoring gives the agency a practical way to start. The browser beacon can then add visitor-side evidence such as JavaScript errors, failed resources, performance issues, and failures that do not appear during every scheduled check.
For WordPress sites, the plugin can add the inside story: core, plugin, and theme state; recent changes; application errors; cron health; mail activity; WooCommerce signals; and other evidence that helps explain what changed.
WordPress makes the evidence deeper, but it is not the price of entry. Custom sites, static sites, ecommerce platforms, and other public websites still belong in the same portfolio.
External monitoring watches the public site. Infrastructure groups show shared dependencies. The browser beacon adds visitor-side evidence. The WordPress connection adds application-side context.
Same agency. Same responsibility. Different depth of evidence.
Fewer Alerts And Better Evidence
Agencies already have plenty of alerts.
Hosting alerts. Security alerts. Plugin update emails. Uptime alerts. WordPress notices. Cloudflare notices. Analytics notices. Slack notifications. Reports nobody has time to read.
I do not want MetricPoints to become another firehose.
One isolated browser error is not always an incident. One slow request does not mean the server is failing. A changed header may be intentional. A visual difference might be a planned content update. And several sites failing together should not automatically become several unrelated emergencies.
The difficult part is deciding which signals matter, which ones may be connected, and which ones could affect the client's business.
A broken checkout matters. A failed lead form matters. A certificate problem matters. Several client sites failing on the same infrastructure matters. A monitoring gap matters too, because an agency cannot confidently call a site healthy without current evidence.
When something does go wrong, the agency needs the history: when it began, what changed, which sites were affected, whether they shared infrastructure, what monitoring was in place, and what was done in response.
That is why MetricPoints is being shaped around site health, incidents, activity, evidence, internal notes, service reports, and alert routing. The next person investigating should not have to start from zero.
The Bigger Promise
The promise I am working toward is still simple:
Know before the client knows.
See the whole portfolio. Catch the quiet problems. Recognize when several sites may share an infrastructure issue. Prioritize failures that can affect the client's business. Be honest when monitoring coverage is incomplete. Keep the evidence needed to understand what happened.
There is still a lot to build, test, and improve. Website assurance is not one check, one plugin, or one clever dashboard. It is the ongoing work of turning a lot of imperfect signals into useful confidence.
That is what I am building with MetricPoints.
If you manage client websites, subscribe. I'm sharing what I'm learning as I build MetricPoints, including the practical checks I use to decide whether a site is actually healthy.