
Track JavaScript Events in Production Without Waiting for Support Tickets Open the Error, Jump to the Session, Fix Faster
MetricPoints keeps advanced frontend diagnostics first-class inside Full Coverage: grouped issues, stack traces, console activity, session context, replay, trends, and actionable debugging evidence. Site owners can stay in a clear Website Health summary while developers open the underlying detail when they need it.
Useful when a browser bug needs the session, page, and preceding actions around it before anyone can fix it.
Advanced browser-event diagnostics are included with Full Coverage.
See Your JavaScript Events in Real-Time
Our event tracking dashboard shows you exactly what's happening with your JavaScript events. No more guessing about what's breaking your site or waiting for user reports.
1. Add Browser Beacon
Add our lightweight JavaScript snippet to your site and start capturing events instantly.
2. Monitor & Alert
Events are captured, grouped, and analyzed in real time with instant alert options.
3. Fix & Improve
Use detailed event reports and stack traces to fix bugs faster and improve user experience.
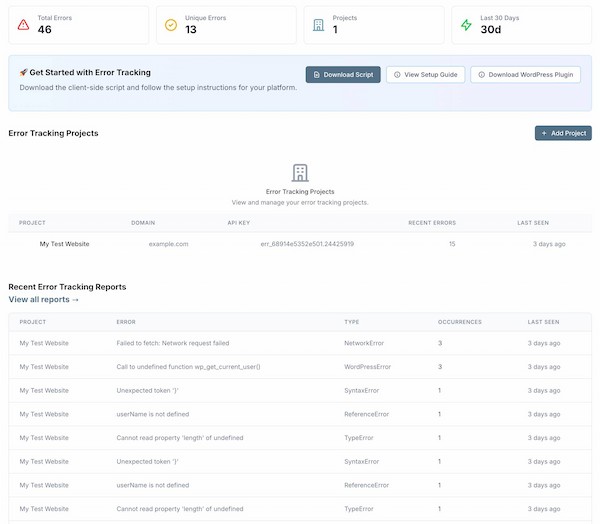
Live event tracking dashboard — grouped, filtered, actionable
Detailed Error Analysis & Stack Traces
Drill down into specific events with full stack traces, user context, and browser information. Identify patterns and fix bugs faster.
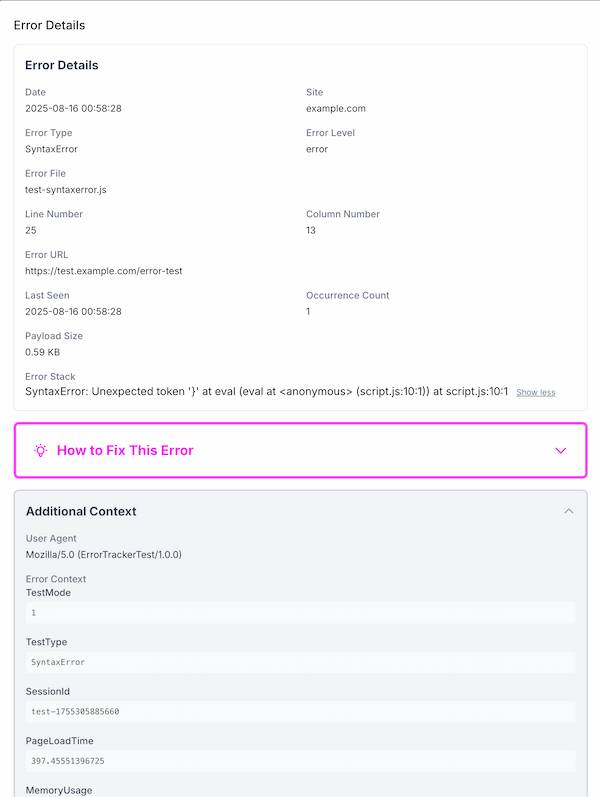
Advanced error analysis with stack traces and user context
Ready to Add Browser-Error Diagnostics to Full Coverage?
Join developers who use MetricPoints to investigate production JavaScript events inside complete website monitoring. Compare Full Coverage options.
Compare Full Coverage – 30-Day Free TrialChoose individual or team access without giving up the underlying diagnostic detail.
Why Use MetricPoints for Browser-Error Diagnostics?
Move from a production error to the page, session, replay, and technical evidence that make it reproducible.
Real-Time Alerts
Get instant notifications when JavaScript events occur. Never miss a critical bug again.
Error-to-Replay Context
Open a grouped browser error and inspect the related session context, replay evidence, page details, and preceding activity.
Easy Integration
Simple setup process. Works with any web application that uses JavaScript.
Fix-Ready Clues
Review the affected page, stack trace, console logs, breadcrumbs, user actions, and performance timing before choosing the fix.
Performance Impact
Lightweight tracking with minimal performance impact. Won't slow down your site.
Historical Data
Track error trends over time and measure the impact of your fixes.
WordPress Plugin
One-click setup with our official WordPress plugin. No coding required.
WordPress Plugin DetailsError Analytics & Trend Analysis
Track JavaScript events over time to identify patterns and trends. Get actionable insights to improve your application's stability.
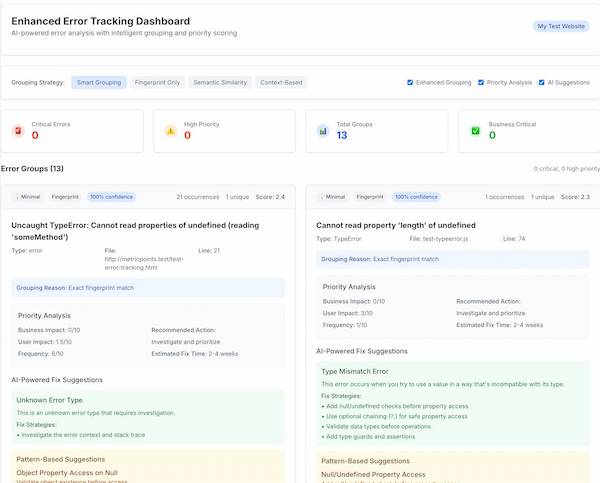
Trend analysis and smart insights help you fix bugs faster
Powerful Tools for Error Management
Everything you need to monitor, analyze, and fix JavaScript events effectively.
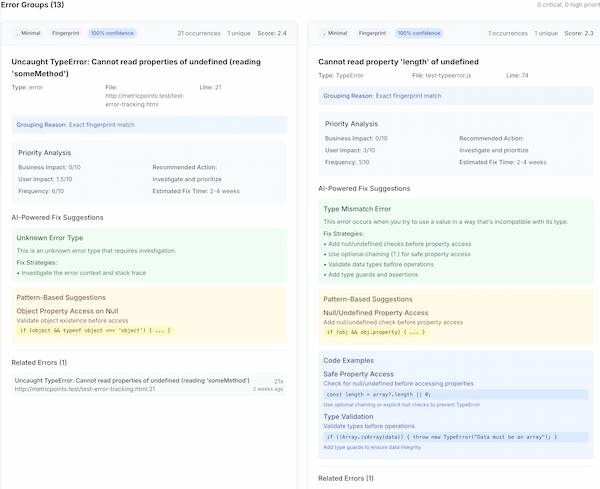
Smart Event Grouping
Automatically group similar events to reduce noise and focus on the most impactful issues.
Who Is This For?
Whether you're a developer, agency, or site owner, MetricPoints helps you catch and fix JavaScript events.
Developers
See exactly what's breaking and where. Get stack traces and user context to fix bugs faster.
Agencies
Monitor client sites proactively and offer event tracking as a premium service to improve client satisfaction.
Site Owners
Protect your user experience and reduce support tickets by catching events before users report them.
See the Website Around Every Error
Browser-error diagnostics are more useful when they sit beside CSP, security-header, performance, DNS, SSL, and uptime evidence.
CSP Monitoring & Security
Protect against security threats
One Timeline for Browser Evidence
CSP, browser-event, performance, and infrastructure signals share context, so teams can see whether a customer-facing failure is isolated or part of a broader site-health change.
Ready to Understand JavaScript Events?
Start capturing production events, group related failures, and give your team better context for debugging.
✓ Advanced grouping • ✓ Session context and replay • ✓ Full monitoring around every error